
.avif)
.avif)

Like most disciplines of a Chief of Staff, many of us don’t come into the role with an encyclopedic knowledge of spreadsheets. However, we’re expected to become power users of spreadsheets on the fly. Even though business math is typically simple algebra, the language of spreadsheet functions can add another layer of complexity to your problem-solving efforts.
So here are 15 spreadsheet functions many people do not know, which have made all the difference for us. If you'd like to practice the functions below, just copy this spreadsheet.
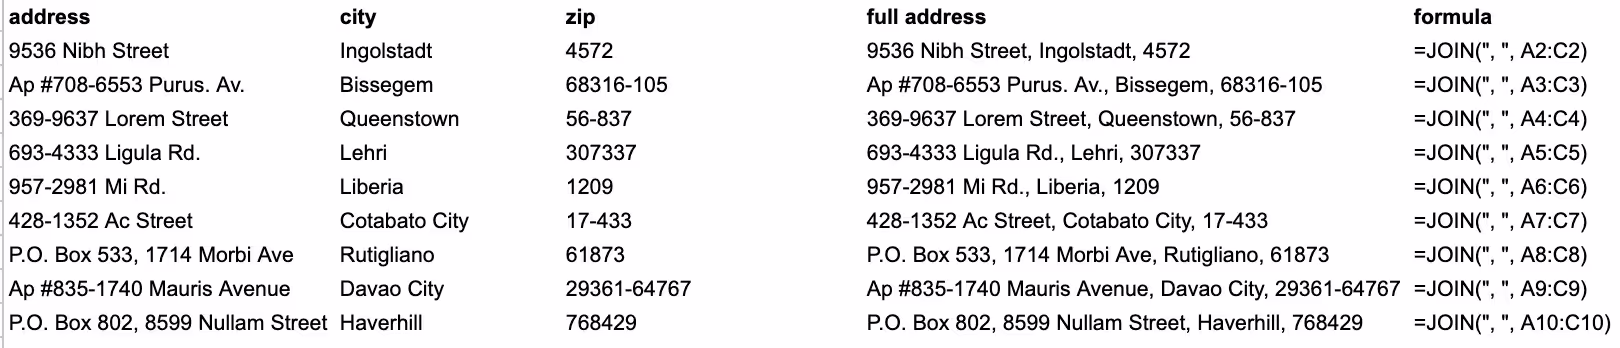
1. JOIN() / TEXTJOIN()
Joins values from multiple cells into a single text string, separated by a specified delimiter.
Example: =JOIN(delimiter - such as a comma, values to join)
Potential Use Cases:
- Data Consolidation: Merge data from different cells for report generation.
- Address Lists: Combine street address, city, and postal code to get a full address, perhaps for a direct mail campaign.
- Project Documentation: Combine various project attributes into a single cell to create a project identifier.
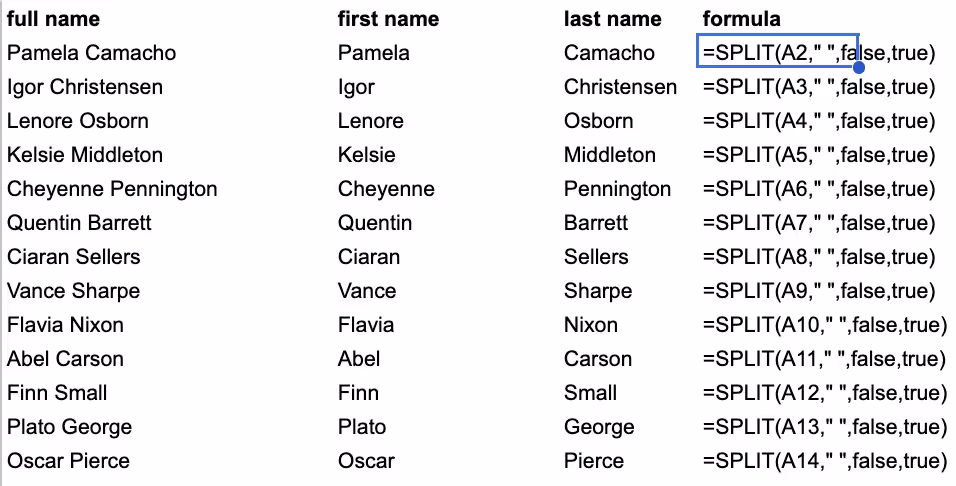
2. SPLIT()
Divides text around a specified character or string, and puts each fragment into a separate cell.
Example: =SPLIT(text to split, delimiter - such as a comma, [split by each instance of delimiter] - true or false, [remove empty text] - true or false)
Potential Use Cases:
- Data Parsing: Split names, addresses, or other text data for analysis.
- Survey Responses: Break down multi-select or stack rank answers into separate columns.
- Log Analysis: Parse log files or data strings for operational insights.
3. VLOOKUP()
Looks up a value in the first column of a table and returns a value in the same row from a specified column.
Example: =VLOOKUP(value to search for, range to search in, column to pull data back from, is your data sorted?)

Potential Use Cases:
- Price Lookup: Retrieve product prices from a pricing table.
- Employee Information Retrieval: Find employee details using their ID.
- Inventory Management: Check stock levels for specific items.
- Sales Data Analysis: Match sales data with product information.
- Customer Information Tracking: Lookup customer orders or details.
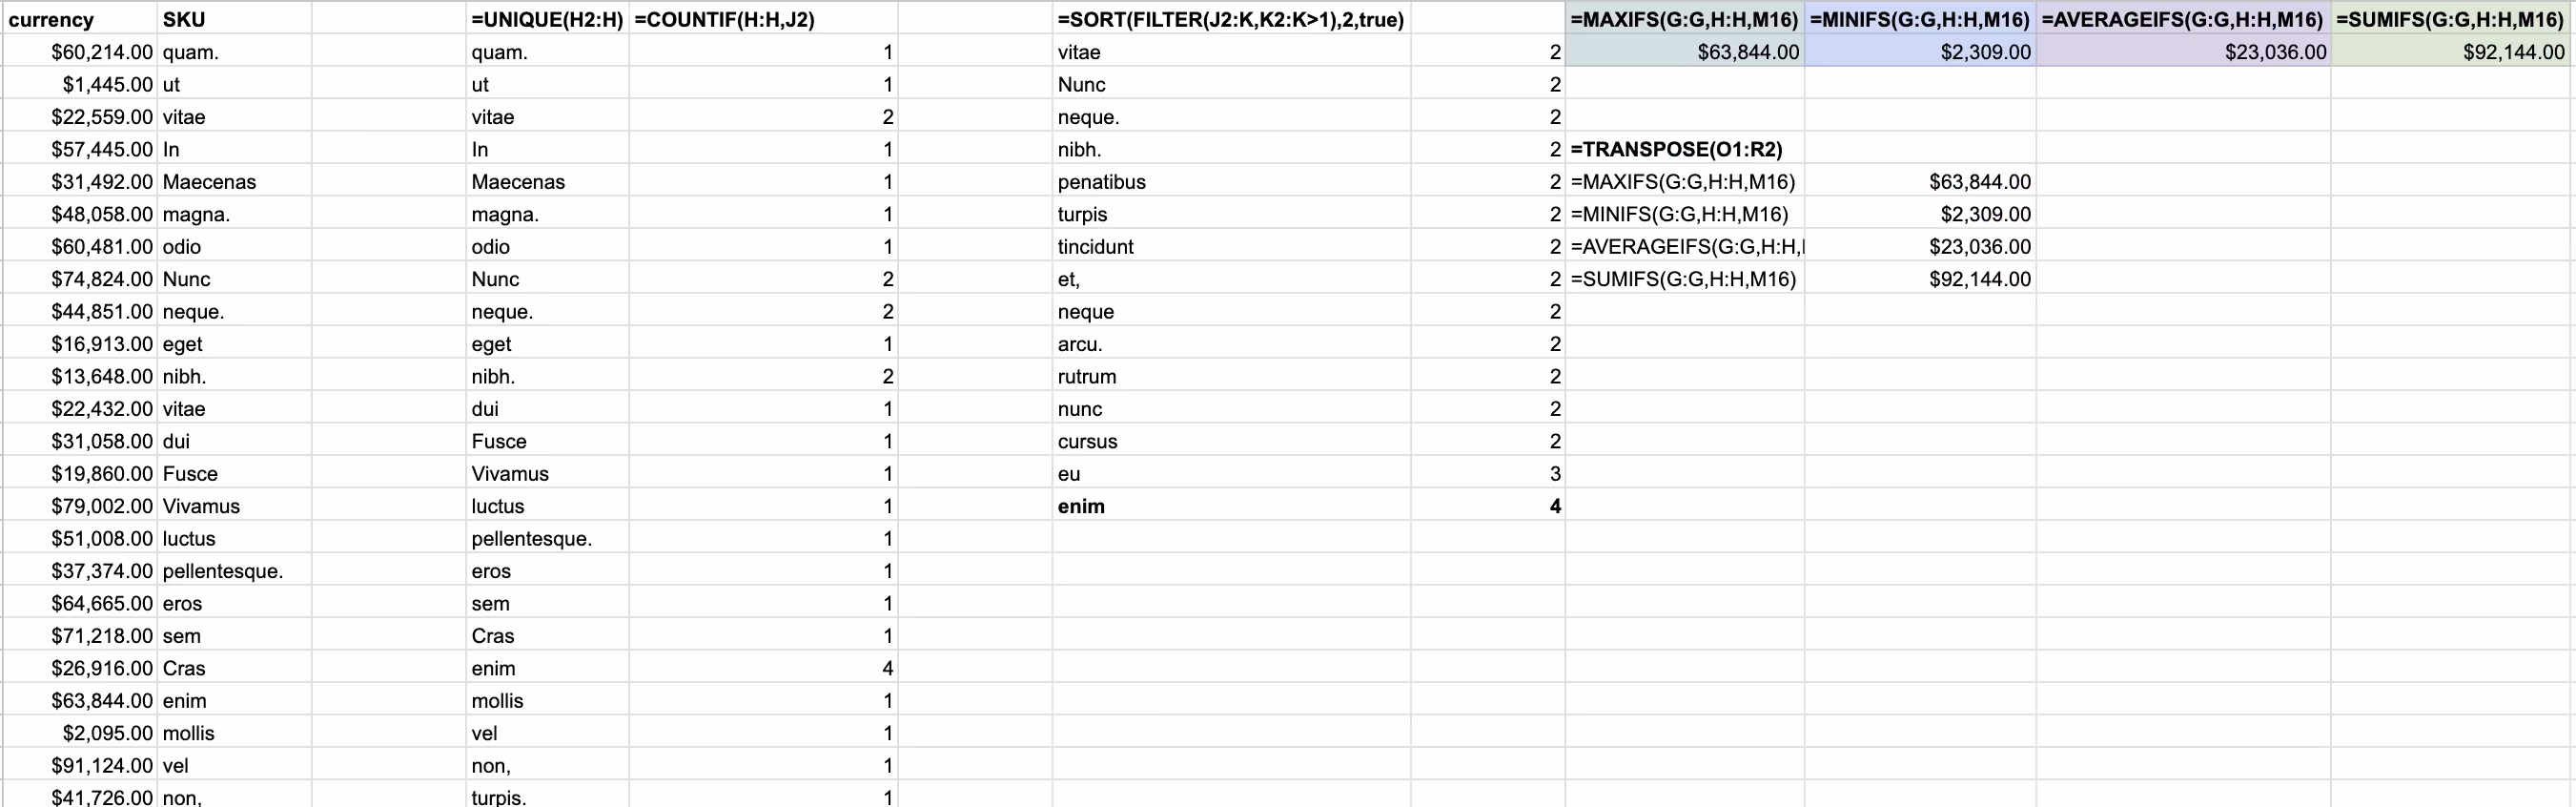
4. SUMIFS()
Adds the cells specified by a given set of conditions or criteria.
Example: =SUMIFS(range to sum, criteria range 1, criterion 1, [criteria range 2], [criterion 2])
Potential Use Cases:
- Financial Analysis: Sum revenues or expenses based on multiple criteria.
- Sales Target Achievement: Calculate total sales in specific regions or periods.
- Budget Allocation: Aggregate costs across different departments or projects.
- Resource Utilization: Calculate total hours spent on a project by a team.
5. AVERAGEIFS()
Calculates the average of a range of cells based on a specified criterion.
Example: =AVERAGEIFS(range to average, criteria_range1, criterion1, [criteria_range2], [criterion2])
Potential Use Cases:
- Performance Evaluation: Average sales or performance metrics based on criteria.
- Customer Feedback Analysis: Calculate average ratings from customer feedback.
- Expense Tracking: Average costs for specific categories or departments.
- Quality Control: Average measurements or test results meeting specific standards.
- Attendance Tracking: Calculate average attendance or participation.
6. MAXIFS()
Returns the maximum value among cells specified by a given set of conditions or criteria.
Example: =MAXIFS(range to find maximum, criteria_range1, criterion1, [criteria_range2], [criterion2])
Potential Use Cases:
- Sales Analysis: Find the highest sale amount for a particular product or region.
- Performance Benchmarking: Identify the top-performing employee or department.
- Financial Reporting: Determine the highest expense or revenue in a given period.
- Inventory Management: Identify the highest stock level of a specific item.
7. MINIFS()
Returns the minimum value among cells specified by a given set of conditions or criteria.
Example: =MINIFS(range to find minimum, criteria_range1, criterion1, [criteria_range2], [criterion2])
Potential Use Cases:
- Cost Reduction Analysis: Identify the lowest cost among various suppliers.
- Risk Assessment: Find the minimum sales figure in a risky market.
- Performance Analysis: Determine the lowest-performing product or service.
- Resource Allocation: Identify the least utilized resource.
8. FILTER()
Filters a range of data based on provided criteria.
Example: =FILTER(range to return, criterion)
Potential Use Cases:
- Data Segmentation: Filter data for specific market segments or demographics.
- Product Analysis: Isolate products with sales above a certain threshold.
- Customer Targeting: Filter customers based on purchase history or behavior.
- Operational Efficiency: Identify processes or departments with performance issues.
- Financial Anomalies: Spot unusual transactions or financial figures.
9. IFS()
Checks multiple conditions and returns a value corresponding to the first TRUE condition.
Example: =IFS(A2>90, "Excellent", A2>80, "Good", A2>70, "Average", TRUE, "Below Average")
Potential Use Cases:
- Performance Grading: Assign grades or ratings based on performance metrics.
- Sales Classification: Categorize sales data into high, medium, or low based on amounts.
- Risk Assessment: Classify investments or projects based on risk levels.
- Budget Analysis: Assign budget status like 'Over', 'Under', or 'On Track'.
- Operational Metrics: Categorize operational metrics into predefined ranges for analysis.
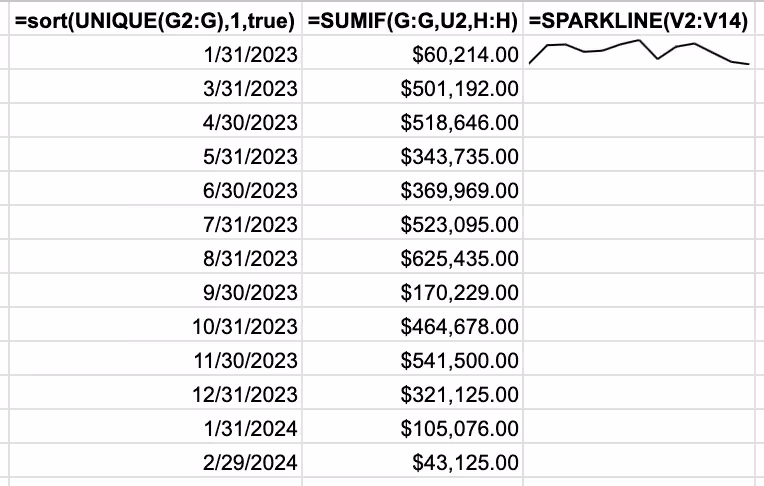
10. UNIQUE()
Returns unique values from a specified range.
Example: =UNIQUE(range)
Potential Use Cases:
- Customer Segmentation: Identify unique customer groups or segments.
- Product Cataloguing: Extract a list of unique products or services offered.
- Market Analysis: Determine unique sales channels or regions.
- Data Cleanup: Remove duplicates from data sets for cleaner analysis.
- Inventory Management: Create a list of unique inventory items.
11. TRANSPOSE()
Shifts the vertical and horizontal orientation of a range of cells.
Example: =TRANSPOSE(range)
Potential Use Cases:
- Data Reformatting: Change data layout for reporting or analysis.
- Dashboard Creation: Rearrange data for visualization in dashboards.
- Comparative Analysis: Compare different data sets side by side.
- Survey Data Organization: Organize survey responses for better analysis.
- Financial Modeling: Shift financial statements for comparative period analysis.
12. SORT()
Sorts a range by the values in one or more columns.
Example: =SORT(range, column, sort ascending?)
Potential Use Cases:
- Priority Setting: Sort tasks or projects based on priority or deadlines.
- Sales Performance Analysis: Rank sales figures to identify top performers.
- Inventory Management: Organize inventory based on quantity or category.
- Customer Prioritization: Sort customers based on value or frequency of purchases.Data Organization: Arrange data for better readability and analysis.
13. SPARKLINE()
Creates mini-charts within a single spreadsheet cell.
Example: =SPARKLINE(range to chart, {"charttype",type; "color", color})
Potential Use Cases:
- Sales Data Visualization: Visualize sales trends over a period within a cell.
- Performance Tracking: Monitor employee or department performance metrics.
- Stock Market Analysis: Display stock price trends in a compact format.Budget Monitoring: Visualize budget utilization against each department.
- Website Analytics: Show web traffic trends over time.
13. EOMONTH()
Returns the last day of the month a specified number of months before or after a given date. It's particularly useful for creating monthly reports, financial models, and managing deadlines.
Example: =EOMONTH(A2, 0) where A2 contains a date. This formula returns the last day of the month for the date in A2. =EOMONTH("2024-01-15", 1) would return the last day of February 2024, which is 2024-02-29 (considering 2024 as a leap year).
Potential Use Cases
- Financial Reporting: Calculate the end date of a reporting period. For instance, if you have a report that needs to cover the entire month, EOMONTH() can be used to automatically find the last day of that month.
- Lease or Subscription Management: For businesses handling leases or subscriptions, EOMONTH() can be used to determine the end date of each billing cycle.
- Inventory Management: In retail or manufacturing, determine the end of the month for monthly inventory assessment. This can be crucial for calculating monthly turnover rates or preparing for stock replenishment.
15. IMPORTRANGE()
Imports a range of cells from a different spreadsheet.
Example: =IMPORTRANGE(google sheet URL, range to import)
Potential Use Cases:
- Consolidating Reports: Combine data from multiple sheets for a comprehensive report.
- Cross-Departmental Data Sharing: Share data across different departments without giving access to the entire sheet.
- Data Syncing: Keep data in sync across various spreadsheets.
- Dashboard Creation: Pull data into a master dashboard from various sources.